What is candle stick
A candlestick (or candlestick chart) is a type of financial chart used to represent the price movement of an asset — such as a stock, forex, cryptocurrency, or commodity — over a specific period of time.
It’s called a candlestick because each “candle” on the chart looks like a candle with a body and wicks (or shadows). Candlesticks are formed using the open, high, low and close.
The Ultimate Candlestick Learning Hub
BULLING CANDLE STICK
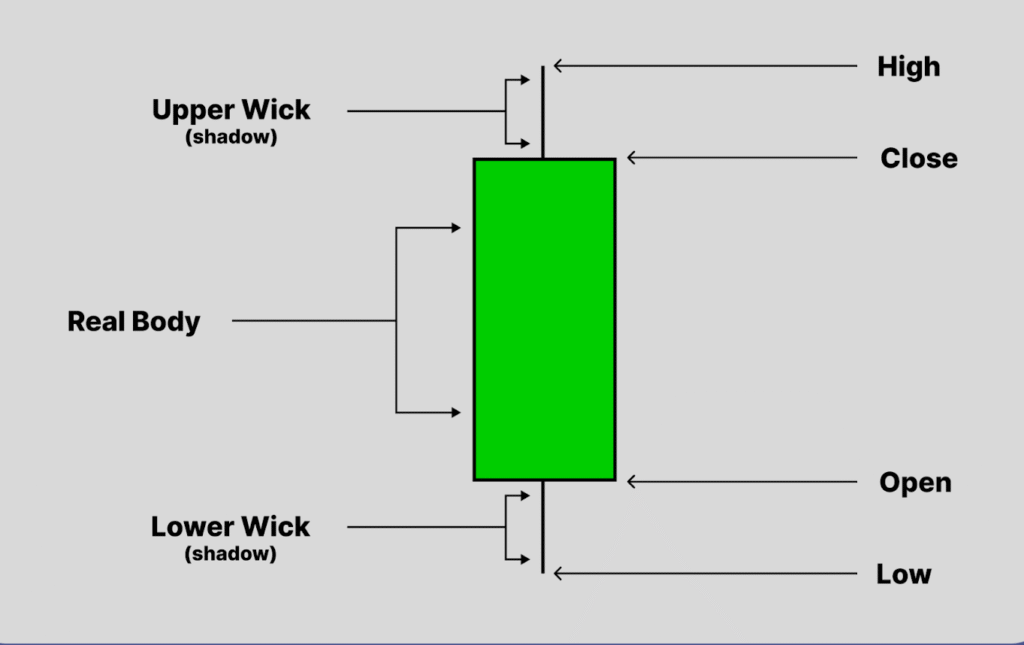
If the close is above the open, we can say that the candlestick is bullish which means that the market is rising in this period of time. Bullish candlesticks are always displayed as green candlestick. So, going ahead whenever we see that the candle is green, we will know that the price has appreciated and the lower end of the candle’s body is the opening price and upper end is the closing price.
BEARISH CANDLE STICK
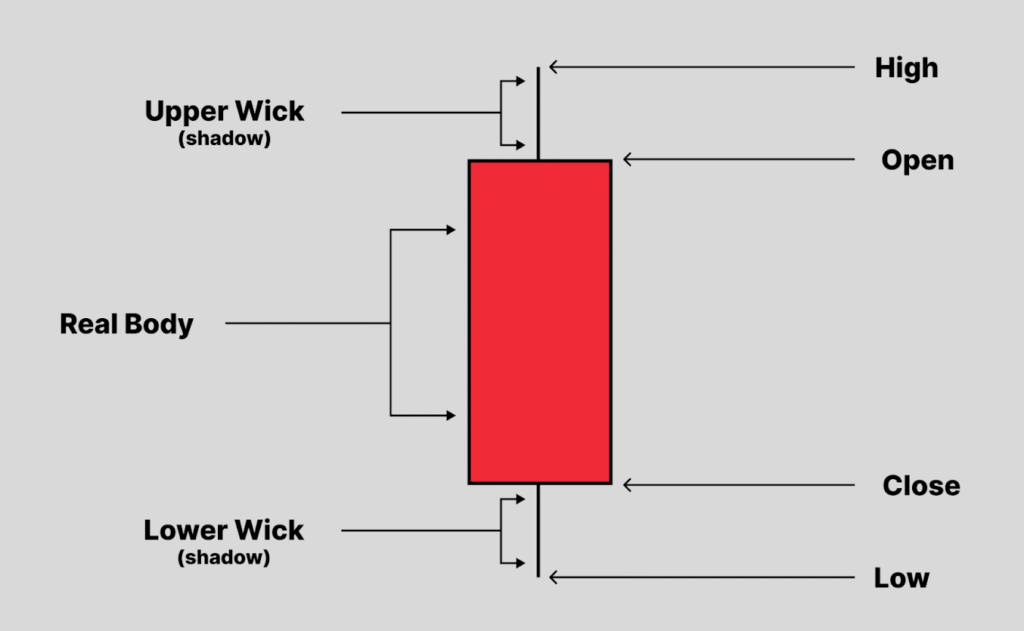
If the close is below the open, we can say that the candlestick is bearish which indicates that the market is falling in this session. Bearish candles are always displayed as red candlesticks.We will know that the upper end of the candle body is the opening price whereas the lower end is the closing price.
Long Vs Short Body
Long bodies refer to strong buying and selling pressure, if there is a candlestick in which the close is above the open with a long body, this indicates that buyers are stronger and they are taking control of the market during this period of time.
Conversely, if there is a bearish candlestick in which the open is above the close with a long body, this means that the selling pressure controls the market during this chosen time frame.
Short and small bodies indicate a little buying or selling activity.
Long Upper Shadow Vs Long Lower Shadow
A long upper shadow shows that buyers pushed the price up strongly, but they could not hold those higher levels. Sellers came in and pushed the price back down before the candle closed.
- Upper shadows signify the session high
A long lower shadow shows that sellers pushed the price down, but buyers recovered strongly, bringing the price back up before closing.
- Lower shadows signify the session low
Candlestickds with short shadows indicate that most of the trading action was confiined near the open and close.
If a candlestick has a longer upper shadow, and short lower shadow, this means that buyers flexed their muscles and bid price higher.
But for one reason sellers came in and pull price back down to end the session back near its open price.
Candlestick has a long lower shadow and short upper shadow, but for one reason buyer came in and pull prices back up to end the session back near its open price.
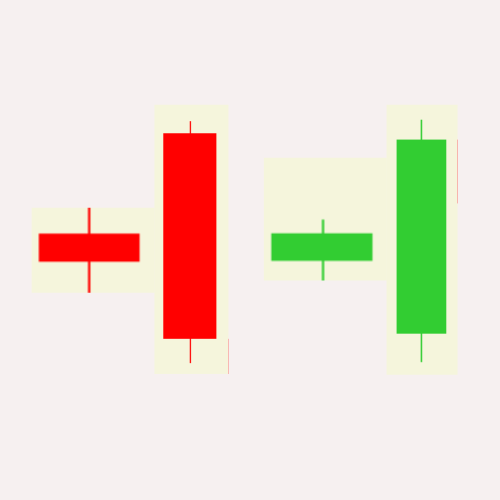
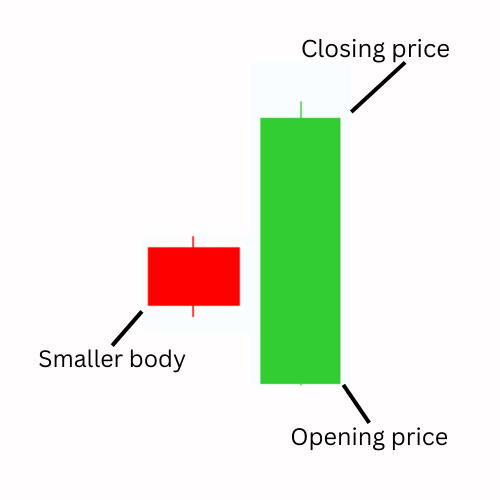
Bearish Engulfing Bar
The Engulfing bar as it states in its title is formed when it fully engulfs the previous candle. The engulfing bar can engulf more than one previous candle, but to be considered an engulfing bar, at least one candle must be fully consumed.
The bearish engulfing is one of the most important candlestick patterns.
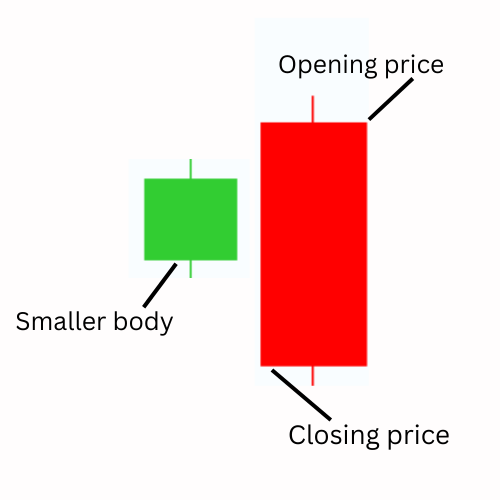
This candlestick pattern consists of two bodies:
The first body is smaller than the second one, in other words, the second body engulfs the previous one.
In case of a bearish engulfng bar, this pattern tells us that sellers are in control of the market.
When this pattern occurs the end of an uptrend, this indicates that buyers are engulfed by sellers which signals a trend reversal.
See the example below:
As you can see when this price action pattern occurs in an uptrend, we can anticipate a trend reversal because buyers are still in control of the market, and sellers are trying to push the market to go down.
You can’t trade any bearish candlestick pattern you find on your chart; you will need other technical tools to confirm your entries.
Bullish Engulfing Bar
The bullish engulfing bar consists of two candlestiks, the first one is the small body, and the second is the engulfing candle.
The bullish engulfing bar pattern tells us that the market is no longer under control of sellers and buyers will take control of the market.
When a bullish engulfing candle forms in the context of an uptrdnd, it indicates a continuation signal.
When a bullish engulfing candle forms at the ends of a downlrend, the reversal is much more powerful as it represents a capitulation bottom.
The example above shows us clearly how the market changes direction after the formation of a bullish engulfing bar pattern.
The smaller body that represents the selling power was convered by the second body that represents the buying power.
The color of the bodies is not important. What’s important is that the smaller one is totally engulfed by the second candlestick.
Don’t try to trade the market using this price action setup alone, because you will need other factors of confluence to decide whether the pattern is worth trading or not.
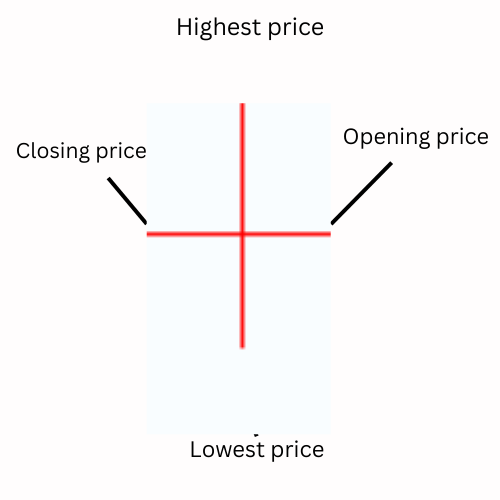
Doji Candlestick
Doji is one of the most important candlestick patterns, when this candlestick forms, it tells us that the market opens and closes at the same price which means that there is equality and indecision between buyers and sellers.
As you can see the opening price is the same as the closing price, this signal means that the market didn’t decide which direction will take. When this pattern occurs in an uptrend or a downtrend, it indicates that the market is likely to reverse.
The chart above shows how the market changed direction after the formation of the Doji candlestick. The market was trending up that means that buyers were in control of the market. The formation of the Doji candlestick indicates that buyers are unable to keep price higher, and sellers push prices back to the opening price.
This is a clear inidication that a trend reversal is likely to happen. Remember always that a Doji indictes equality and indecision in the market, you will often find it during periods of resting after big moves higher or lower. When it is found at the bottom or at the top of a trend, it is considered as a sign that a prior trend is losing its strengths.
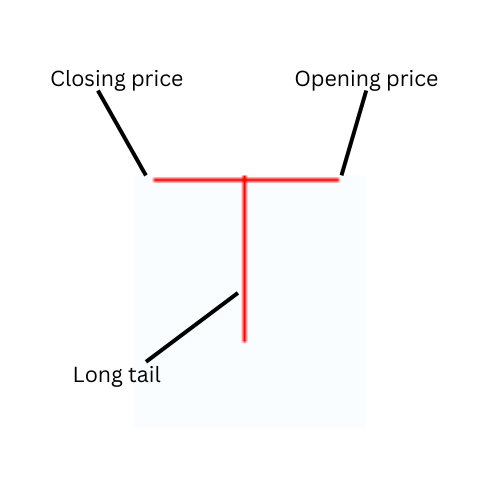
Drogon Fly Doji
The Dragonfly Doji is a bullish candlestick pattern which is formed when the open high and close are the same or about the same price.
What characterizers the dragonfly Doji is the long lower tail that shows the resistance of buyers and their attempt to push the market up.
The illustration above shows us a perfect dragonfly Doji. The long lower tail suggests that the forces of supply and demand are nearing a balance and that the direction of the trend may be nearing a major turning point.
In the chart above, the market was testing the previous support level that caused a strong rejection from this area. The information of the Dragonfly Doji with the long lower tail shows us that there is a high buying pressure in the area. If you can identify this candlestick pattern on your chart, it will help you visually see when the support and demand are located. When it occurs in a downtrend, it is interpreted as a bullish reversal signal.
Gravestone Doji
The Gravestone Doji is the bearish version of the dragonfly Doji, it is formed when the open and close are the same or about the same price.
The image above illustrates a perfect gravestone Doji. This pattern indicates that while buyers were able to push prices well above the open.
Later in the day sellers overwhelmed the market pushing the price back down.
This is interprreted as a sign that bulls are losing their momentum and the market is ready for a reversal.
See another illustration below:
The chart above shows a gravestone Doji at the top of an uptrend after a period of strong bullish activity. The formation of this candlestick pattern indicates that buyers are no longer in control of the market.
Hammer (Pin bar)
A hammer signals a possible reversal near the end of a downtrend. From experience, it shows strong selling early in the session, but buyers step in aggressively, reject lower prices, and push the close back up—hinting that selling pressure is weakening.